This article looks at the World Growth Index (WGI).
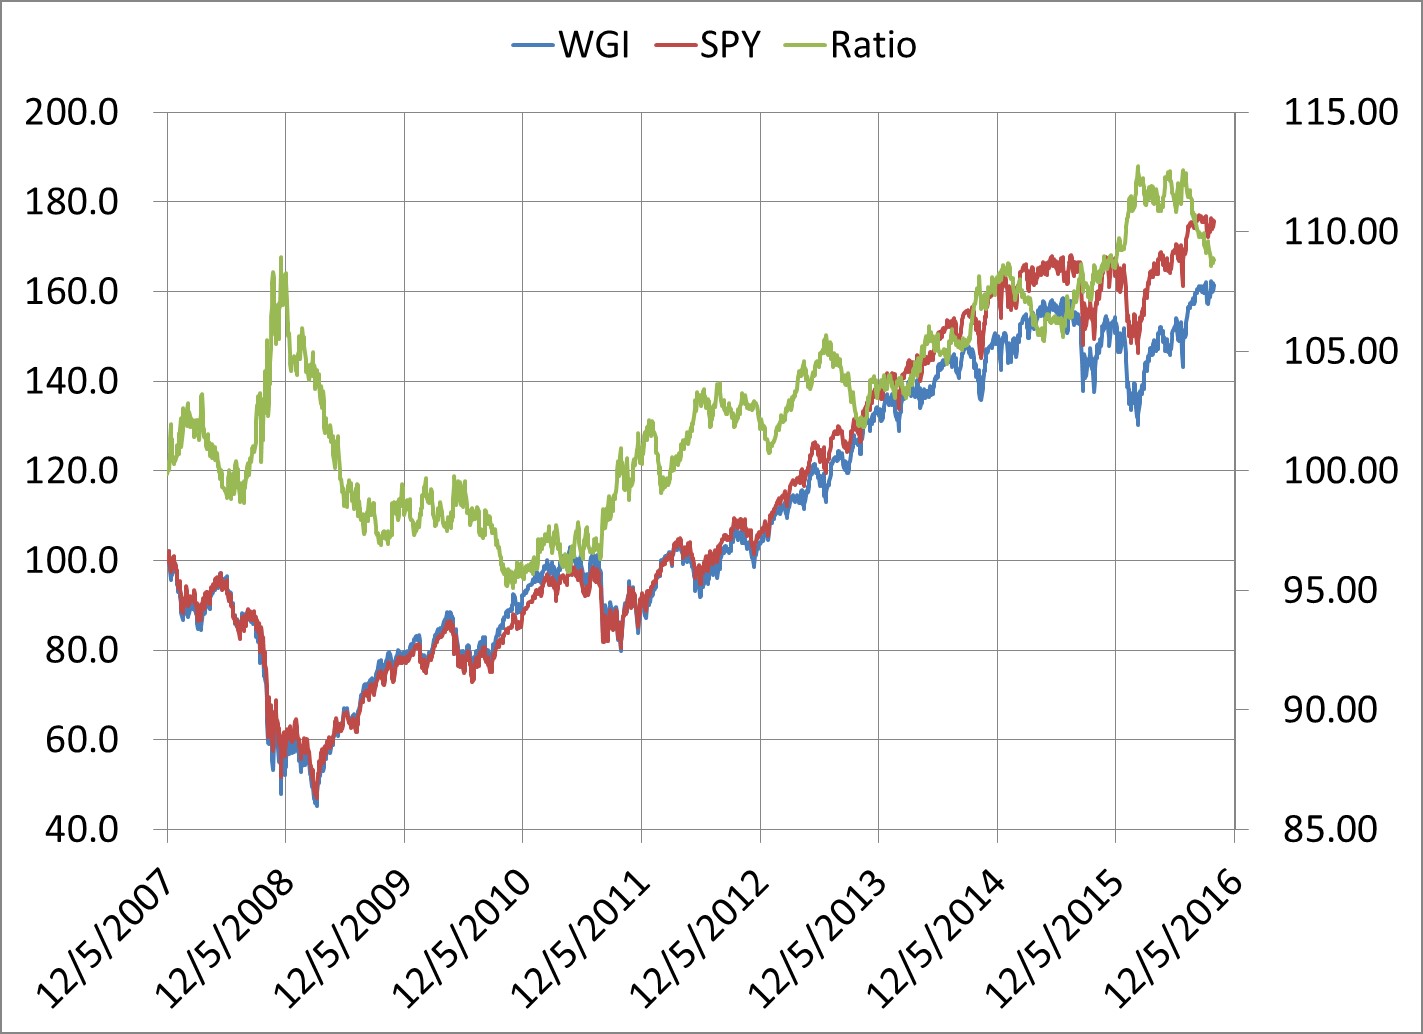
The chart compares the ratio between WGI (blue line) and SPY (red line) from 12/5/2007 through the present. Both were set at 100. The ratio (green line) compares their relative performance. A rising ratio indicates that SPY is outperforming. A falling ratio indicates WGI is outperforming.
WGI is made up of 20% each in EEM (iShares MSCI Emerging Markets), EFA (iShares MSCI EAFE (Europe, Australia, Far East)), IWM (iShares Russell 2000), QQQ (PowerShares QQQ Trust), SPY (SPDR S&P 500).
WGI is rebalanced daily and includes any distributions (dividends and capital gains).
As you can see, SPY has outperformed WGI over this time frame, although there are periods when WGI outperformed, most notably after the Great Recession period.
We did not design WGI to under or outperform SPY. We just wanted a way to more accurately reflect the world wide economy and markets today.